Jace Higa / Data Scientist

Jace Higa
Data Scientist | Data Analyst | Data Engineer
to My
Welcome
to My
Portfolio
Explore my story, skills, and work as a data-driven problem solver.
My passion for data science started with a love for numbers and a curiosity about how things work. I’ve always loved working with numbers, and data science has given me the perfect outlet to turn that passion into impact– transforming messy data into clear, actionable insights. I enjoy working across the entire data lifecycle, from scraping and cleaning raw data to analyzing patterns and visualizing trends in tools like SQL and R. I bring a strong work ethic, curiosity, and big-picture thinking to every project. I do beyond just executing tasks, I aim to understand the broader context and deliver insights that challenge assumptions and drive informed decisions. I am especially interested in roles that blend data engineering and analysis, where I can contribute to building scalable infrastructure while applying analytical thinking to real-world problems.
Resume
Experience
May 2025 – Present
Data Science Master’s Student
Willamette University
Salem, OR
While completing my graduate studies I have:
- Analyzed complex datasets to generate key insights through reports and visualizations.
- Implemented dashbaording tools RShiny and Grafana.
- Engineered data ingestion pipelines and scraping tools using Python with SQL-based transformations.
- Designed and automated scalable data pipelines for metro systems using Airflow, DuckDB, PostgreSQL, and MinIO (S3).
- Applied machine learning techniques like Decision Trees and kNN to study both wine and educational data.
- Applied survival analysis methods to real-world time-to-event problems.
- Designed and implemented a survey to support the continued funding of a quantitative tutoring center.
May 2024 – September 2024
Data Analyst Intern
McIlhenny Company
Avery Island, LA
While Interning at Tabasco, I:
- Identified discrepencies in sauce manufacturing techniques through an analysis of a large production dataset.
- Utilized RStudio and the Tidyverse to clean and transform the data to help uncover trends across key metrics.
- Delivered data-driven insights through clear visualizations and actionable reports.
- Presented findings to stakeholders across operations and leadership teams, empowering the organization to make more informed decisions.
April 2023
Awarded Best Overall
and Best Statistical Model/Analysis
Data Analyst Participant
Willamette University DataFest
Salem, OR
While participating in DataFest:
- Conducted exploratory and statistical analysis on datasets provided by the American Bar Association, delivering insights under a 48 hour deadline.
- Sourced and integrated external data to enhance the depth and context of analysis, improving the relevancy of insights.
- Communicated key findings to ABA representatives through a presentation, utilizing data visualizations created on Studio.
Education
May 2025 – Present
Master’s of Science in Data Science
Willamette University
Salem, OR
I am in the process of completing my Master’s degree and will have my diploma by the end of August.
August 2022 – May 2025
Bachelor’s of Science in Data Science
(Minor in Mathematics)
Willamette University
Salem, OR
Over the course of three years, I earned a Bachelor’s degree in Data Science with a minor in Mathematics and am on track to complete my Master’s this summer.
Skills
Skills
- Languages: R, SQL, Python, JavaScript, HTML/CSS
- Tools: GitHub, RStudio, MS 365
- Data Engineering: Railway, Airflow, PostgreSQL, MinIO (S3), DuckDB
- Modeling: Regression, Decision Trees, kNN, Survival Analysis, Textual Analysis
- Visualization: R Shiny, Grafana, ggplot2, Observable
Projects
Note: GitHub links with more information are accessible by clicking the project title.
This data engineering project focuses on projecting NBA player statistics to support betting insights. Player data was scraped daily using Python and the nba_api package, saved in JSON format, and uploaded to Railway. SQL queries were used to process and insert the data into structured tables. The processed data was then analyzed, and a dashboard was built in Grafana to visualize trends and support informed decisions.

This MLB Data Acquisition project utilizes two automated scrapers, one built with Selenium to extract data from MLB.com, and the other leveraging the statsapi package for structured statistics. The collected data is stored in JSON format, deployed via Railway, and systematically ingested into a PostgreSQL database for analysis.

During this 48-hour DataFest competition, I performed exploratory data analysis using the tidyverse package in R. I also applied the tidytext package to extract insights through textual analysis. To enrich our findings, I conducted external research and integrated supplemental data sources. I then used ggplot2 to create compelling visualizations.

Over the course of this project, my partner and I explored gender-based wage disparities. After performing exploratory data analysis, we summarized our key findings in an interactive dashboard built with R Shiny.
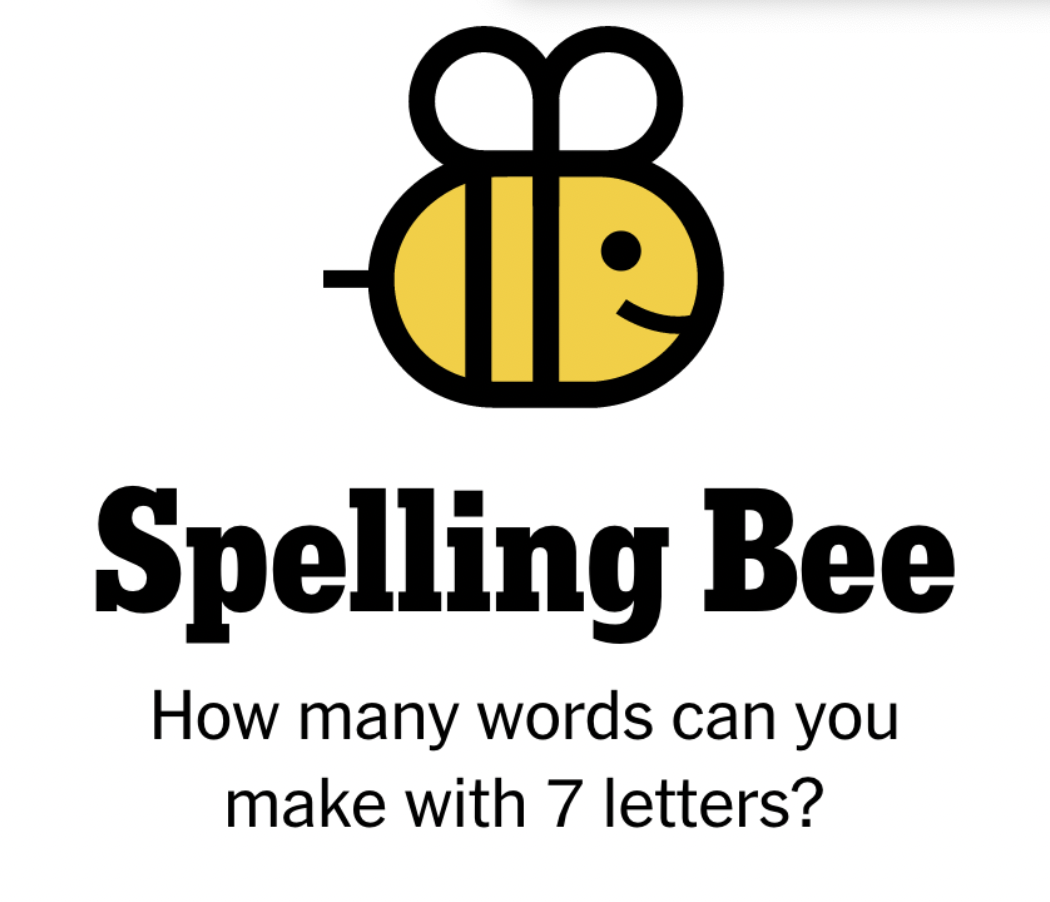
This project involves the development of a solver tool for The New York Times “Spelling Bee” game. Users input a set of letters, and the tool generates a table of valid words, sorted by length with the longest words prioritized. The output also includes a dynamic word cloud, where words longer than seven letters are highlighted in bold and pangrams (words that use all available letters) are distinguished in teal for quick recognition.